Northstar: Making Data Science More Interactive

Unleashing the potential of Big Data for a broader range of users requires a paradigm shift in the algorithms and tools used to analyze data.
Exploring complex datasets needs more than a simple question-and-response interface. Ideally, the user and the system would engage in a “conversation,'' each party contributing what it does best. The user can contribute judgment and direction, while the machine can contribute its ability to process massive amounts of data, perhaps even predicting what the user might require next. However, even with sophisticated visualizations, digesting and interpreting large, complex datasets often exceeds human capabilities.
ML and statistical techniques can help in these situations by providing tools that clean, filter and identify relevant data subsets. Unfortunately, support for ML is all too often added as an afterthought: the techniques are buried in black boxes and executed in an all-or-nothing manner. Results can often take hours to compute, which is unacceptable for interactive data exploration. Moreover, users want to see the result as it evolves. They want to interrupt, change the parameters, features or even the whole pipeline. Meanwhile, data scientists are still using text-style batch interfaces from the 80s.
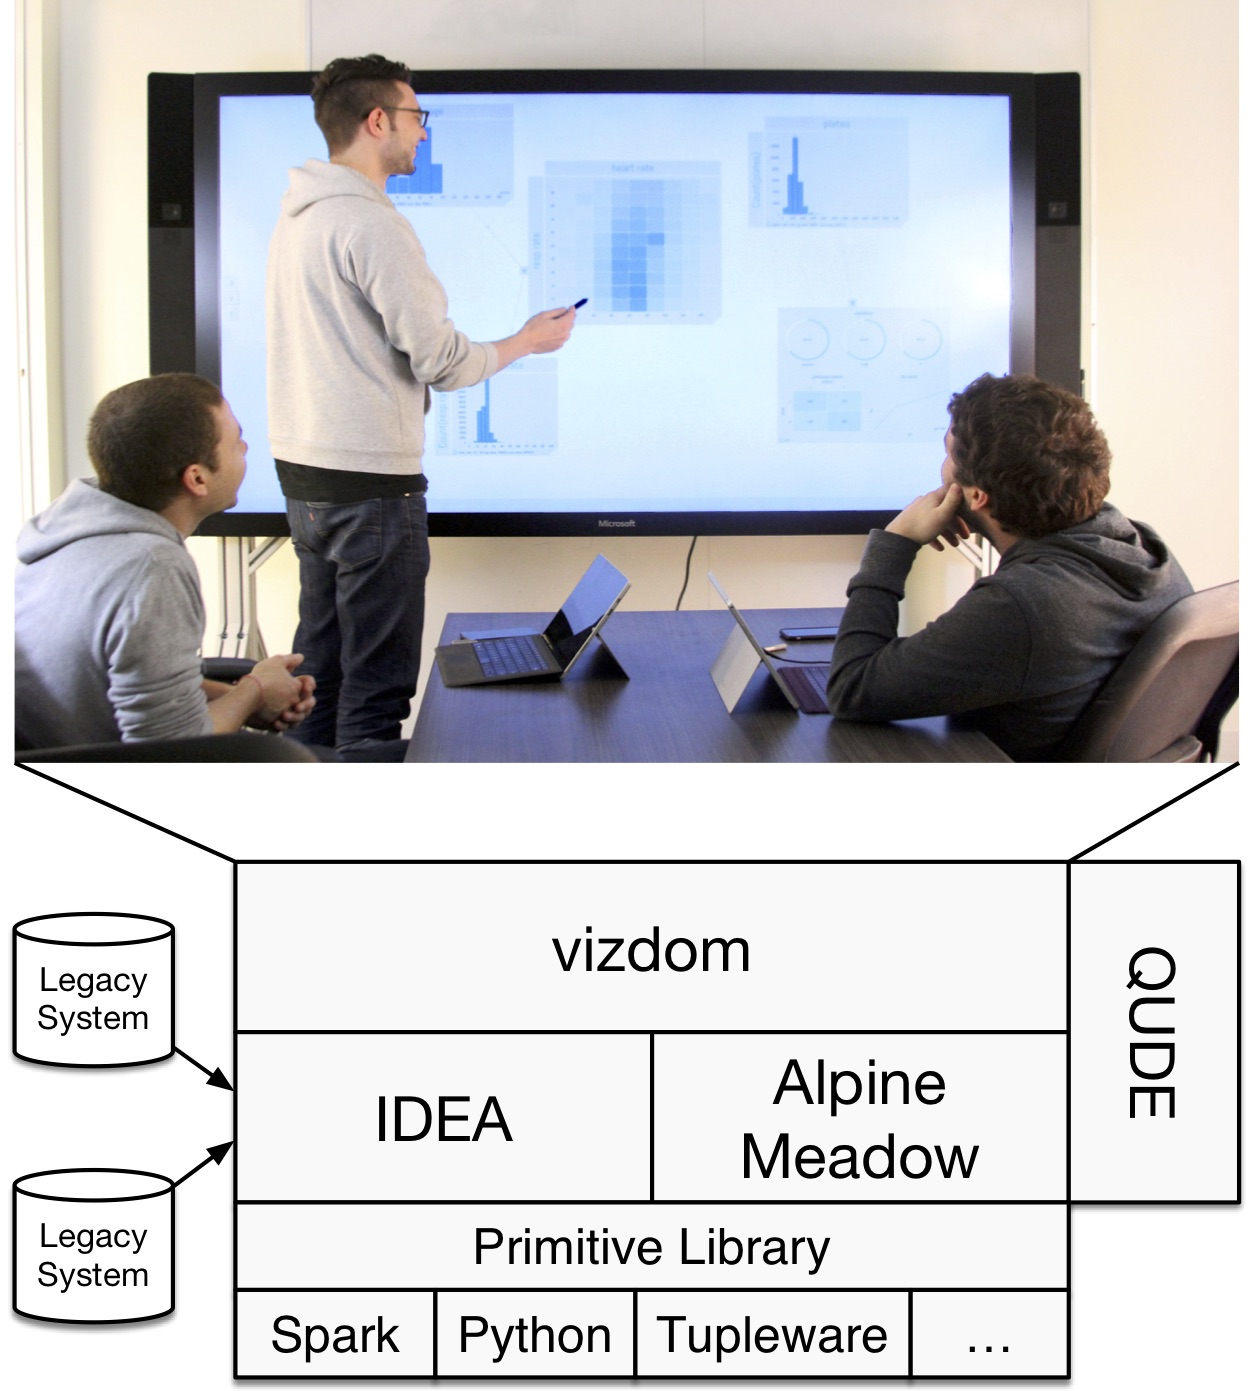
As part of the Northstar project, we envision a completely new approach to conducting exploratory analytics. We speculate that soon many conference rooms will be equipped with an interactive whiteboard, like the Microsoft Surface Hub. Data scientists and domain experts can use the whiteboards to avoid the usual week-long, back-and-forth interactions. Instead, we believe that the two can work together during a single meeting using an interactive whiteboard to visualize, transform and analyze even most complex data on the spot. This setting will undoubtedly help the domain experts to quickly arrive at an initial solution, which can be further refined offline. Our hypothesis is that we can make data exploration much easier for laymen while automatically protecting them from many common errors. Furthermore, we hypothesize that we can develop an interactive data exploration system that provides meaningful results in sub-seconds even for complex ML pipelines over very large datasets. The techniques will not only make machine learning more accessible to a broader range of users, but also ultimately enable more discoveries compared to any batch-driven approach.
Northstar includes four main components:
- Vizdom: a novel visual data exploration environment specifically designed for pen and touch interfaces, such as the Microsoft Surface Hub.
- IDEA: an intelligent cache and streaming approximation engine, which enables users to analyze data and create ML pipelines with immediate feedback over any type of data source and independent of the data size.
- QUDE, which monitors every interaction the user does and tries to warn about common mistakes and problems.
- Alpine Meadow: a ”query” optimizer for machine learning that allows users to declaratively indicate what they want (e.g., “predict label X”) while the system automatically figures out the best ML pipeline (i.e., plan) to achieve that goal.
Citations
Tim Kraska. (2018) Northstar: An Interactive Data Science System. PVLDB 11(12): 2150-2164.
Carsten Binnig, Benedetto Buratti, Yeounoh Chung, Cyrus Cousins, Tim Kraska, Zeyuan Shang, Eli Upfal, Robert C. Zeleznik, and Emanuel Zgraggen. (2018). Towards Interactive Curation & Automatic Tuning of ML Pipelines. DEEM@SIGMOD 2018: 1:1-1:4
